If you sell online, you’ve hit the measurement jackpot! You get to track your whole sales funnel from start to finish, in the one spot.
You have a whole world of ecommerce metrics at your fingertips.
So let’s talk about what the ecommerce metrics mean and which ones should be your Key Performance Indicators.
Ecommerce Metrics
“Metrics” are the actual numbers you should be looking at. But every metric also needs to be segmented to see what types of visitors perform better for that metric. Without doing this, you can’t work out how to actually improve a metric.
Here is your handy guide to how to define different ecommerce metrics, and what you should track,
1. Sales (transactions, orders etc.)
You need to track sales to be able to get any other ecommerce metrics.
Some ecommerce platforms, like Shopify, let you insert your Google Analytics tracking code to start measuring sales with no development needed.
2. Revenue
Actual dollar figures made, without any costs removed.
3. Conversion rate
Now we’re on to some more useful ecommerce metrics! The conversion rate is the percentage of users who take a desired action.
4. Number of visits that included one or more purchases divided by the total number of visits.
Increasing the conversion rate means making it easier for your visitors to say “yes” to the sale. This could mean acquiring more ready-to-buy visitors or improving their on-site experience through usability, information or product offerings.
But be warned! Just because people are buying, doesn’t mean you’re optimising your storefront…
5. Average Order Size
You also need to pay attention to the size of the orders. How many items were in the average order? You can influence this by recommending related products or offering deals for buying more.
6. Average Order Value
What amount of revenue did the average order bring? Are you selling enough higher value items or are your budget deals too good? Experiment with related product suggestions or deals with minimum purchase requirements.
7. Revenue per User
Average revenue made per unique visitor to your store. The Revenue per User metric is a good way to combine both Conversion Rate and Order Value, to make sure that both are increasing!
8. Cost per acquisition
How much did it cost you to make each sale? This is normally calculated based on advertising spend, but any costs that you can apply to particular marketing channels can be included.
For example, if you spent $500 on Facebook advertising and got 10 orders, your CPA was $50. This metric is step one to working out your overall ROI.
9. Abandonment rate
What percentage of people who started buying, stopped? Where? Why? Did they add products to their cart and then never checkout? Did they get part way through your checkout process and stop buying?
Segments
The second part of the ecommerce measurement puzzle is segmentation.
Segments let you compare useful ecommerce metrics across different groups of visitors. These are used to answer “Is this better than that?” questions.
Ecommerce metrics without segments are unactionable. There’s no point in seeing your Average Order Value if you don’t know what types of visitors had the biggest orders, so you can figure out ways to get more of them.
Here are the most useful audience segments for ecommerce,
10. Traffic source
In Google Analytics, you view traffic sources from “top level” channels (eg. Email or Social), individual sources (eg. Facebook or my-referral-partner.com) to specific campaigns or advertisements.
Answer questions like “Do visitors from some traffic sources buy more than others?”
11. New vs returning visitors
Many people visit a site more than once before making a purchase. Compare your ecommerce metrics between first and subsequent visits, and how long it takes to make a purchase.
12. Device used
Compare your metrics between visitors on desktops, mobile phones and tablets to start gaining insights into questions like: Is your store easy to use on mobile? Are your products the kinds of things people buy on mobiles? Should you be focusing on mobile advertising?
13. Store behaviour
You can implement a range of features to help influence visitor behaviour, so make sure you check your metrics to see if they work. Does using the search function or reading reviews increase conversion rate? Does clicking on the recommended related products increase order value?
(This is the trickiest set of segments to track and you might need to ask for some custom tracking to be developed in order to answer these questions.)
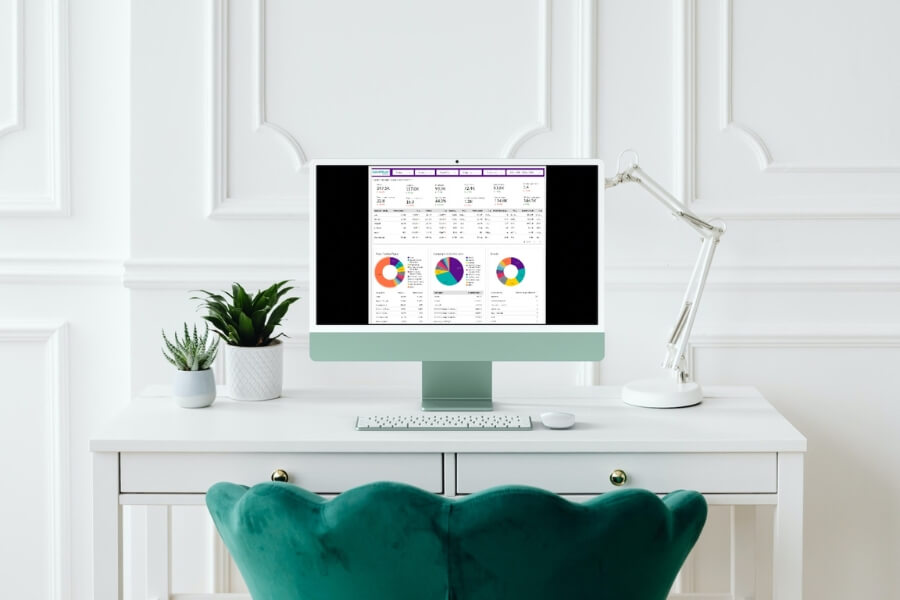
This is what reporting on the same metrics between two different segments can look like. See how each of the columns (metrics) shows very different numbers for desktop and mobile traffic?
Over enough time and transactions, you’ll be able to start drawing conclusions about how these two types of visitors perform in your store and what you can do about it.
Are you ready to take the next step with your online store?
Is your platform growing with you, and giving you the data you need?
Regardless of the platform you’re on, we’re ready to work with you to help grow your revenue and sales.
We also just happen to be BigCommerce certified partners — the ideal platform for ecommerce stores looking to scale.


